TradeHub Tools Field Reference
Primary field chart
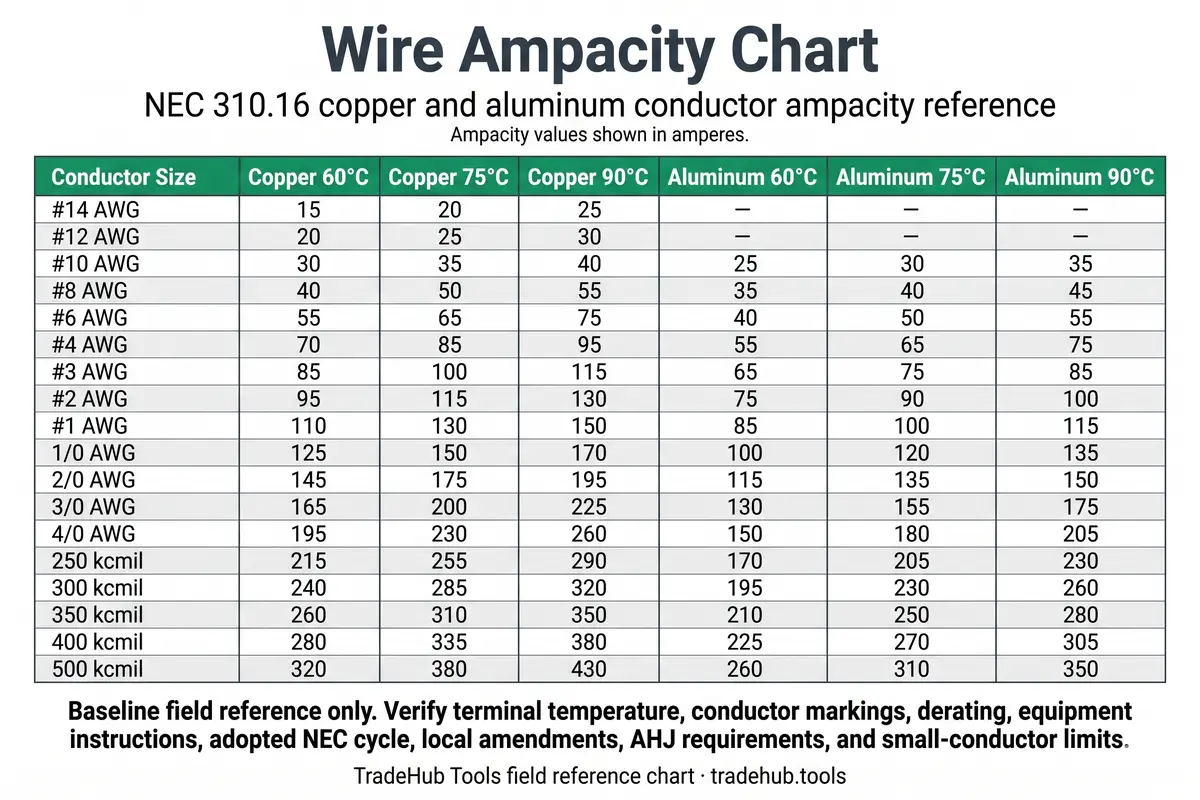
Wire Ampacity Chart
Use this chart as a baseline ampacity lookup for common copper and aluminum conductors. The values are field-reference starting points only and do not replace the adopted NEC, conductor markings, terminal ratings, equipment instructions, derating rules, or local inspection authority.
| Conductor Size | Copper 60°C | Copper 75°C | Copper 90°C | Aluminum 60°C | Aluminum 75°C | Aluminum 90°C | Field Note |
|---|---|---|---|---|---|---|---|
| #14 AWG | 15 | 20 | 25 | — | — | — | Small conductor limits usually control. |
| #12 AWG | 20 | 25 | 30 | — | — | — | Small conductor limits usually control. |
| #10 AWG | 30 | 35 | 40 | 25 | 30 | 35 | Confirm material, terminals, and OCPD. |
| #8 AWG | 40 | 50 | 55 | 35 | 40 | 45 | Common branch/feeder starting point. |
| #6 AWG | 55 | 65 | 75 | 40 | 50 | 55 | Check terminals before using higher values. |
| #4 AWG | 70 | 85 | 95 | 55 | 65 | 75 | Derating may change usable ampacity. |
| #3 AWG | 85 | 100 | 115 | 65 | 75 | 85 | Confirm material and terminals. |
| #2 AWG | 95 | 115 | 130 | 75 | 90 | 100 | Check before derating and voltage drop. |
| #1 AWG | 110 | 130 | 150 | 85 | 100 | 115 | Verify equipment terminals and wiring method. |
| 1/0 AWG | 125 | 150 | 170 | 100 | 120 | 135 | Service/feeders may add limits. |
| 2/0 AWG | 145 | 175 | 195 | 115 | 135 | 150 | Check sets, terminals, and OCPD. |
| 3/0 AWG | 165 | 200 | 225 | 130 | 155 | 175 | Review service/feeders and equipment. |
| 4/0 AWG | 195 | 230 | 260 | 150 | 180 | 205 | Large conductors need field review. |
| 250 kcmil | 215 | 255 | 290 | 170 | 205 | 230 | Confirm raceway, sets, derating, and terminations. |
| 300 kcmil | 240 | 285 | 320 | 195 | 230 | 260 | Confirm terminations and AHJ conditions. |
| 350 kcmil | 260 | 310 | 350 | 210 | 250 | 280 | Review sets and equipment. |
| 400 kcmil | 280 | 335 | 380 | 225 | 270 | 305 | Check terminals and derating. |
| 500 kcmil | 320 | 380 | 430 | 260 | 310 | 350 | Equipment and AHJ requirements may control. |
This chart is a baseline wire ampacity lookup only. It does not approve final wire sizing, terminal temperature use, conductor-count adjustment, ambient correction, NM cable limitations, voltage drop, service conductor sizing, OCPD sizing, or equipment maximum ampacity limits.
When This Chart Applies
Use this chart when you need a quick field reference for common copper and aluminum conductor ampacity values before running a full conductor check. It is most useful when the conductor material, size, and insulation-temperature basis are known and the job condition has not yet introduced derating, terminal, equipment, or wiring-method limits.
Material Known
Copper and aluminum values are separated because the same wire size does not carry the same ampacity across materials.
Column Basis Known
60°C, 75°C, and 90°C columns have different uses. Final usable ampacity may still be capped by terminal temperature.
Baseline Lookup Only
The chart is a starting point. Field conditions can lower or change the usable ampacity before the conductor is approved.
Use the Calculator When Conditions Stack
A chart can show a starting ampacity value, but it cannot verify terminal temperature limits, conductor-count adjustment, ambient correction, NM cable limits, service-conductor rules, voltage-drop effects, equipment instructions, or final OCPD coordination.
Use when THHN/THWN-2 insulation, aluminum conductors, terminal temperature, conductor-count derating, ambient correction, or service/feeders affect usable ampacity.
Use when load amps, breaker size, conductor material, voltage drop, or workflow handoff affects conductor selection.
Common Field Misses
- Using the 90°C column as a final ampacity instead of treating it as an adjustment or correction basis where permitted.
- Ignoring 60°C or 75°C terminal temperature limits on equipment terminations.
- Forgetting current-carrying conductor adjustment when multiple conductors share the same raceway or cable.
- Treating voltage drop, OCPD sizing, or equipment maximum ratings as if they were approved by the ampacity table alone.
Related code references
Related NEC Field References
Source Alignment and Use Scope
This field chart is a quick-reference summary used to support TradeHub calculator workflows and common NEC 310.16 ampacity lookup. It is for screening and planning only and does not reproduce the complete adopted NEC table, approve a final conductor selection, or replace local amendments, manufacturer instructions, plan review, utility requirements, or AHJ interpretation. Review the TradeHub Code Citation & Source Log for source alignment records and the TradeHub Methodology page for how field references are scoped.
Wire Ampacity FAQ
Is a wire ampacity chart the same as a final wire size calculation?
No. A wire ampacity chart is a baseline conductor ampacity lookup. Final conductor selection can also require terminal temperature limits, conductor-count adjustment, ambient temperature correction, wiring method limits, equipment instructions, voltage drop, and overcurrent protection review.
Can I use the 90 degree ampacity column as the final ampacity?
Not by itself. A higher insulation-temperature column may be used for adjustment or correction only when permitted, but the final usable ampacity still cannot exceed the applicable terminal temperature limit.
Why does the same wire size show different amp ratings?
The ampacity depends on conductor material, insulation temperature rating, terminal temperature limits, ambient conditions, number of current-carrying conductors, and wiring method. That is why the chart is only a starting point.